To get the most
recent charts for Total FMLS Areas, please
sign up below.
You'll get instant access
to charts for sales, inventory, days on the market and the new "Maitski Line
Charts" for the absorption rates.
How to Use the
NEW "Maitski Line Reports" to
Get an Idea About Which Way Homes Prices Are Going
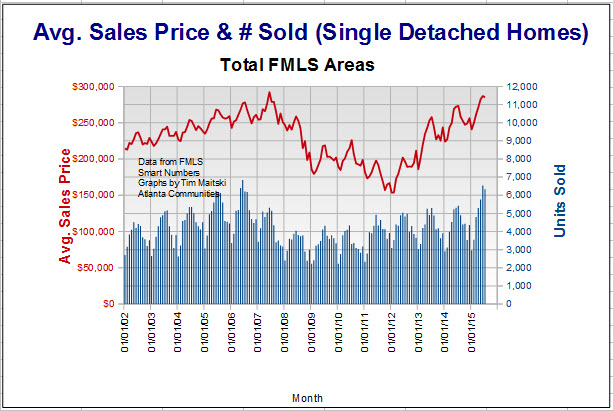
For years I have been putting out monthly price charts for single
family home prices in Atlanta.
This chart shows the number of sales per month (demand) vs. the
price
It's nice to see what has happened
but it does nothing to predict the future of prices.
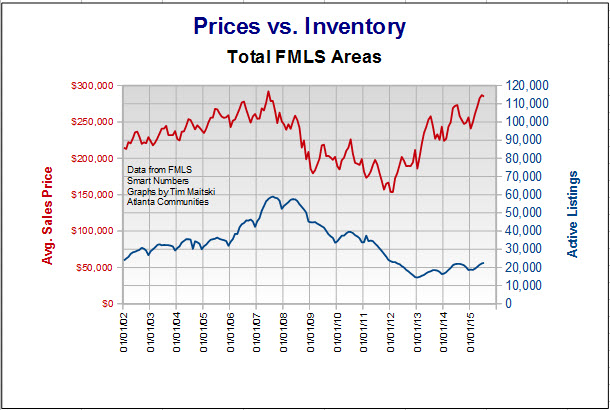
Then I began tracking the
inventory of single family detached homes (supply).
The key "aha moment" was when I took a look at the ratio of
inventory/sales. You can call it the supply/demand ratio
(Absorption rate). I divided the monthly inventory of homes by the monthly
number of sales and plotted it against the monthly sales prices.
I had never
seen a chart of absorption rates over any significant length of time plotted alongside
home prices.
Since we've had some of the most dramatic price
moves in Atlanta real estate over the past ten years, the thought
was that I might be
able to see how prices and absorption rate are correlated and
possibly see if it could be used as a leading indicator.
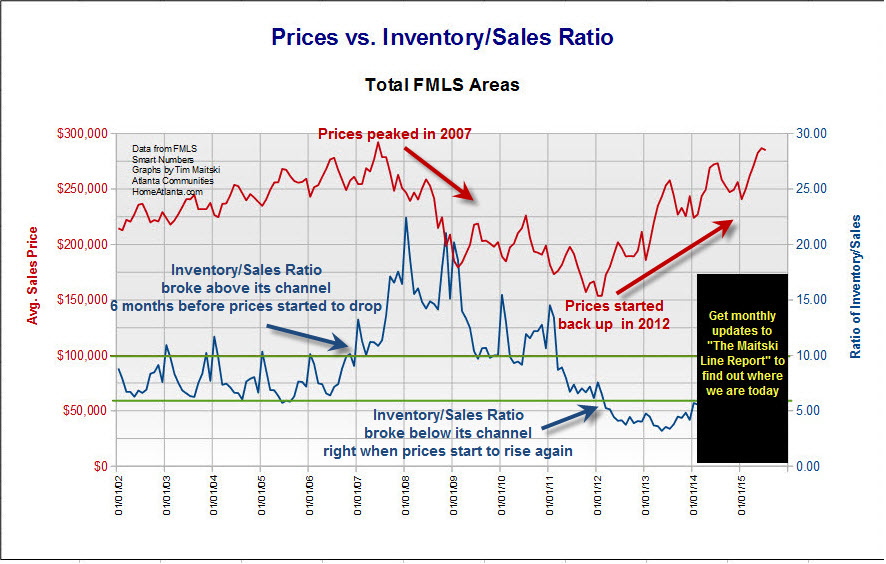
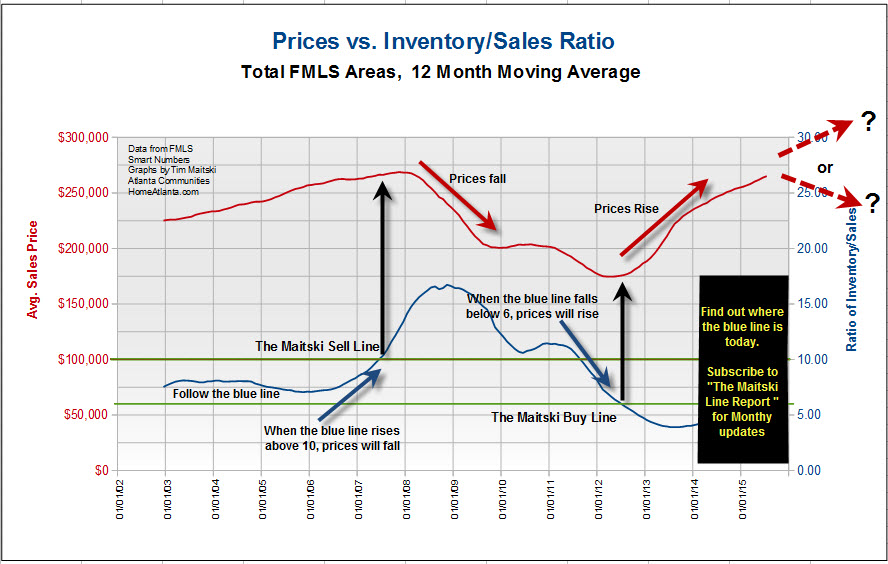
In the chart below, pay attention
the blue line (Inventory/Sales Ratio). When it stayed above
its historic range (between the two green lines), in 2007 prices soon fall.
When it fell below its historic range, in 2012 prices soon rose
dramatically.
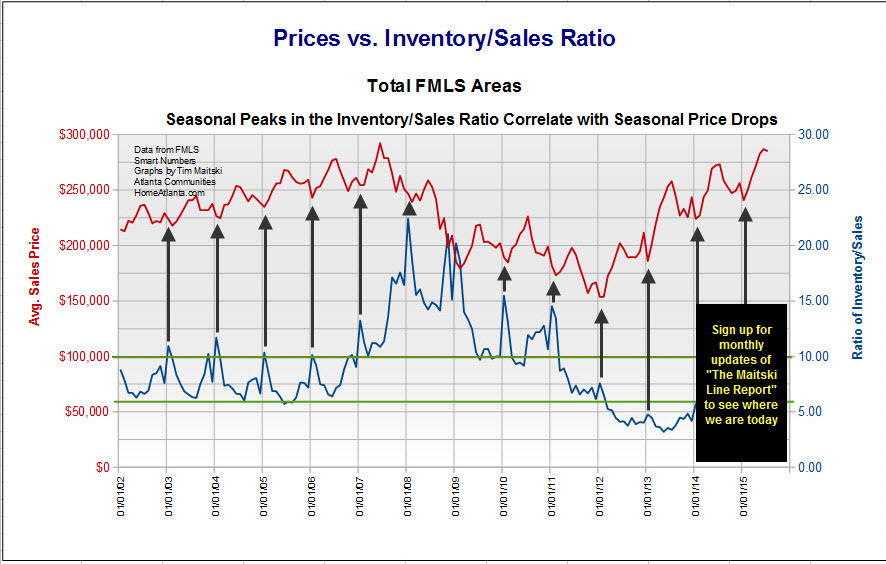
In the chart below, notice how the seasonal peaks and
valleys of the Inventory/Sales ratio (the blue line) corresponds with the seasonal
peaks and valleys of prices (the red line).
Every year in January, when the
inventory/sales ratio peaks (more supply than demand) prices seem to
be at their seasonal lows. When the tables turn in the summer
(low supply and high demand) prices are at their seasonal highs.
This is a picture of supply and demand in action. It validates the
correlation of this indicator to prices on a yearly
basis and therefore should correlate to the longer real estate
cycles. Taking advantage of these longer real estate cycles is
what we are really after. We all got a wake up call repeating
the mantra that real estate prices can only go up.
You can also see that the
inventory/sales ratio stayed in the fairly tight band, between 6 and
10, between 2002 to 2006. This was a time when prices in
Atlanta were rising steadily at about 4.5% per year.
Look at what happened when that ratio went above 10 and
kept going up in the spring of 2007. 6-12 months later prices
started to fall. There was too much supply and not enough
demand and therefore prices started to adjust. Real estate isn't liquid
like stocks and bonds. It takes months instead of seconds for
prices to adjust. Therefore you have some time to take
advantage of the information.
Prices kept falling until the
inventory/sales ratio fell to below 6 in the spring of 2012.
Since then, the inventory/sales ratio has been below six and prices
have risen by 52% from their lows. Supply is low while demand
is high and therefore the prices have adjusted higher.
To smooth out the seasonality
noise, I plotted a twelve month moving average. With the chart
below, follow the blue line, the 12 month moving average for the
inventory/sales ratio (absorption rate). A rise to above 10
preceded the start of the fall in prices in 2007. I
call this "The Maitski Sell Line". If you were thinking
of selling, that would have been a great time to get out near the top.
If you were thinking of buying, that would have been a great time to wait
it out and rent instead.
When the blue line fell below 6 in
2012, shortly thereafter
prices increased sharply. I call this "The Maitski Buy Line".
That was the time to buy if you were renting. If you owned a
home and wanted to sell, it might have been a time to wait, if possible,
knowing that prices would eventually go higher.
Of course, past performance is no guarantee of
future performance, but taken along with other statistics, such as
total days on the market, one can have an objective indicator on
which to base a buy/sell decision on. History never repeats
itself exactly but it's worthwhile to study past patterns and apply
them to today's market.
My theory is based on simple economics. When the
supply/demand ratio is outside of its historic channel, prices will
change until that ratio gets back to normal levels.
If the ratio is high, prices will fall.
If the ratio is low, prices will rise.
To find out where the blue line is today, sign
up for the monthly updates in the box below. I not only have
the charts I created for the overall Atlanta area, I have detailed
charts for 37 more localized areas around Atlanta.
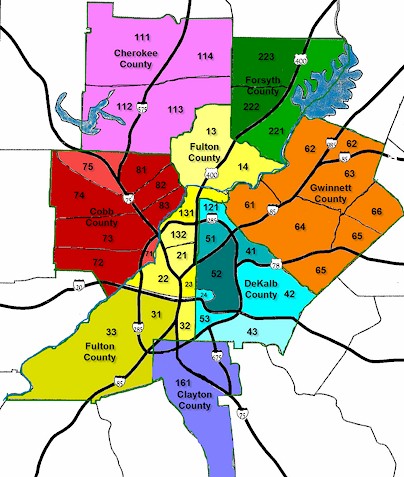
For more localized statistics, please click on the
map area or the links below.
If you buy a home with me and then
want to sell within one year due to a "Maitski Sell Signal", I will
sell your home for a total of 4.5% commission instead of my
customary 6% commission
Our market area is in the
north metro Atlanta area.
We service Cobb County,
north Fulton County, Dekalb
County, Forsyth County and
Gwinnett County. We
are very familiar with Sandy
Springs, Dunwoody, Marietta,
Roswell, Alpharetta,
Buckhead, and Midtown.
We have sold homes inside
the perimeter and outside
the perimeter. We
can't know everything so for
clients who want to look for
property in Peachtree City,
Newnan, Stone Mountain,
Douglasville, Macon and
areas further out we will
gladly recommend a good
agent who specializes in
those areas.
We help buyers negotiate
with builders for
residential new construction
houses. New houses in
Atlanta are hot right now.
We can represent you in the
purchase of your new house
built by any of the
following builders: Torrey
Homes, MDC Homes, Centex
Homes, Pulte Homes, Morrison
Homes, Ryland Homes, John
Wieland Homes, Winmark
Homes, Meridian Homes, John
Willis Homes, Benchmark
Homes and many more home
builders.
We can help clients find
short term apartments for
rent but normally we don't
work with clients who are
just looking for rentals.
We do help clients find
Atlanta condos. We can
also help you purchase HUD
homes in Atlanta. We
are an authorized agent with
them and have the HUD key to
get into HUD homes. We
have access to foreclosure
homes that banks want to
sell.
We love showing executive
homes and luxury homes. We
always like to know how
people find our site.
Send us an email and tell us
which search term you used.
Some terms that we might be
found by are realty Atlanta,
Ga homes, Atlanta realty,
condos Atlanta, Atlanta
realestate, Atlanta
property, houses Atlanta,
Atlanta realtors, Ga houses,
or realtors Atlanta.
Maybe you found us by typing
in Atlanta MLS listings, or
Atlanta MLS search, or MLS
Atlanta GA. Hopefully we
don't come up under nursing
homes or funeral homes.
It is always amazing to me
how the Internet can allow
total strangers to find each
other and build new business
relationships. It
truly is becoming a small,
interconnected world.